Key findings
- Rat sightings reported to 311 fell 20.6% citywide, from 25,230 (Dec 2023 to Nov 2024) to 20,025 (Dec 2024 to Nov 2025). NYC DSNY
- The decline continued into 2026: sightings were down about 22% in the first seven months of the year compared with 2025. Bloomberg
- About 1 in 4 New York City households (26.8%) reported mice or rats in their home or building in 2023, up from 24.3% in 2021. NYCHVS via NYC Health
- Staten Island had the lowest household rate in 2023 (10.5%) but the fastest increase of any borough, up 44% from 7.3% in 2021. our analysis
- The Health Department inspected 0.8% of Staten Island properties for rats in 2025, compared with 71.8% in Manhattan and 11.8% citywide. our analysis of NYC Health data
- The Bronx has the city's heaviest rat burden: 42.2% of households reported mice or rats in 2023, and Bronx districts had the highest share of properties with active rat signs in 2025 (27.6% and 27.3%). NYC Health
- New York City recorded 24 human leptospirosis cases in 2023, a record, compared with about 3 cases a year from 2001 to 2020. NYC Health
- New York ranked No. 3 on Orkin's 2025 Rattiest Cities list, behind Los Angeles and Chicago. Orkin
- Staten Island Community District 1, which includes Stapleton, West Brighton and Clifton, is one of six districts set for full Empire Bin trash containerization by the end of 2027. NYC Mayor's Office
How many rats live in New York City?
Nobody has counted New York City's rats, but the best available estimates range from about 2 million to about 3 million.
The most cited estimate comes from Columbia University statistician Jonathan Auerbach, who in 2014 used 311 rat reports from 2010 and 2011 to estimate how many of the city's property lots had rats. Assuming roughly 50 rats per infested lot, he arrived at about 2 million rats, and noted that his method likely overestimates the total. NPR / WGBH
In 2023, M and M Pest Control repeated Auerbach's method with newer 311 data and estimated close to 3 million rats, a 42% increase since 2010. Pest Management Professional
The popular claim of one rat per New Yorker, about 8 million, has no scientific basis. Auerbach traced it to a 1909 estimate about rats in the English countryside.
| Estimate | Data year | Rats | Method |
|---|---|---|---|
| Auerbach (Columbia), 2014 | 2010–2011 | ~2 million | 311 capture–recapture |
| M and M Pest Control, 2023 | 2022–2023 | ~3 million | Same method, newer data |
| "One rat per person" myth | n/a | ~8 million | None |
Are rat sightings in NYC going up or down?
Down. Reported rat sightings have fallen year over year every month since November 2024, the month the city began requiring smaller residential buildings to put trash in lidded bins.
New Yorkers reported 20,025 rat sightings to 311 between December 2024 and November 2025, down 20.6% from 25,230 the year before. The steepest drops came in the fall: October was down 34.5% and November down 39.4%. NYC DSNY
Show the monthly data
| Month | Dec 2023–Nov 2024 | Dec 2024–Nov 2025 | Change |
|---|---|---|---|
| December | 1,185 | 918 | −22.5% |
| January | 1,742 | 1,320 | −24.2% |
| February | 1,672 | 1,242 | −25.7% |
| March | 1,833 | 1,807 | −1.4% |
| April | 2,103 | 1,835 | −12.7% |
| May | 2,733 | 2,118 | −22.5% |
| June | 2,500 | 2,319 | −7.2% |
| July | 2,743 | 2,182 | −20.5% |
| August | 2,644 | 2,141 | −19.0% |
| September | 2,452 | 1,845 | −24.8% |
| October | 2,086 | 1,367 | −34.5% |
| November | 1,537 | 931 | −39.4% |
| Total | 25,230 | 20,025 | −20.6% |
The trend held into 2026. Sightings were down about 22% in the first seven months of the year compared with the same period in 2025. Bloomberg Between January 1 and July 11, 2026, reports fell from about 12,017 to 9,023 citywide. Hoodline, citing NYC Open Data
Not every neighborhood improved. Manhattan Community Board 3 (East Village and Lower East Side) logged about 300 rat complaints in that period, up 37.6% from 218, and was one of nine community districts where rat calls rose. Hoodline
311 data measures reports, not rats. Reporting habits, weather and app usage all affect the totals.
Which NYC borough has the most rats?
The Bronx, by most measures. Staten Island has the fewest, but its numbers are climbing the fastest.
In the 2023 NYC Housing and Vacancy Survey, 42.2% of Bronx households reported mice or rats in their home or building, the highest share of any borough. Brooklyn followed at 28.8%, Manhattan at 24.5%, Queens at 20.6% and Staten Island at 10.5%. NYC Health
| Borough | Homes with mice or rats, 2023 | Change since 2021 | Properties inspected, 2025 | 311 rat sightings, H1 2025 vs H1 2024 |
|---|---|---|---|---|
| Bronx | 42.2% | +10.5% | 23.4% | −14.4% |
| Brooklyn | 28.8% | +22.0% | 15.2% | −28.6% |
| Manhattan | 24.5% | −4.3% | 71.8% | −0.4% |
| Queens | 20.6% | +10.2% | 2.1% | −21.7% |
| Staten Island | 10.5% | +43.8% | 0.8% | −8.6% |
| Citywide | 26.8% | +10.3% | 11.8% | −18.4% |
Change since 2021 is the relative change in the household rate. Inspection coverage is the share of tax lots the Health Department inspected for rats at least once in 2025. 311 changes cover January to June. Sources: NYC Health Department Environment & Health Data Portal; PIX11
Outdoor sightings follow a similar pattern. In the city's 2020 Community Health Survey, 50.8% of Manhattan adults said they had seen mice or rats outside their building in the past 90 days, compared with 34.2% citywide and 15.2% on Staten Island. NYC Health
Staten Island rat statistics: what the data shows
Staten Island still has the lowest rat numbers in the city, but more households are reporting rodents, and the city sees very little of the problem through inspections.
Staten Island households reporting mice or rats in their home or building
A 44% relative increase, the largest of any borough. The survey's 95% confidence intervals do not overlap (6.0–8.6% in 2021, 9.0–12.0% in 2023), so the rise is unlikely to be noise. Source: NYC Housing and Vacancy Survey via NYC Health.
The city inspects fewer than 1 in 100 Staten Island properties
In 2025, the Health Department inspected 0.8% of Staten Island's tax lots for rats. In Manhattan, where much of the borough is inspected proactively, the figure was 71.8%. None of the city's four Rat Mitigation Zones, where every property is inspected twice a year, is on Staten Island, so inspections here mostly happen after someone files a 311 complaint. This is a difference in programme design, not neglect. Rat indexing is targeted at areas already known to have heavy rat activity, and the Health Department states plainly that because the Bronx and Manhattan are indexed proactively, inspection findings in those boroughs should not be compared with the other boroughs. The city's open data disclaimer makes the same point: a neighborhood showing more properties with active rat signs may simply have been inspected more often. The practical consequence for Staten Island is that city inspection data cannot tell you much about rat activity here either way — which is why 311 reports, analysed below, are the more useful signal on the island. NYC Health
The Health Department reports active rat signs as a share of all tax lots, and on Staten Island that figure rounds to 0.0% for the borough as a whole in 2025 — not because there are no rats, but because so few properties are inspected that the measure carries almost no signal here. The city’s own community district figures for Staten Island, as published:
| Community district | Properties inspected | Failed, any reason | Active rat signs |
|---|---|---|---|
| CD 1: St. George & Stapleton (North Shore) | 1.2% | 0.4% | 0.1% |
| CD 2: South Beach & Willowbrook (Mid-Island) | 0.7% | 0.2% | 0.0% |
| CD 3: Tottenville & Great Kills (South Shore) | 0.6% | 0.1% | 0.0% |
| Staten Island | 0.8% | 0.2% | 0.0% |
| Citywide | 11.8% | 3.0% | 2.4% |
All figures are as published by the NYC Health Department (Rat inspections indicator, 2025) and are expressed as a share of all tax lots, not of inspected ones. We have deliberately not converted them into a per-inspected-property rate: with only 0.6–1.2% of Staten Island lots inspected, dividing by that base multiplies rounding error more than a hundredfold and yields a figure that looks precise but is not. Staten Island’s active-rat-signs share rounds to 0.0% at borough level, which reflects the near-absence of inspections here rather than the absence of rats. See methodology.
Reported sightings on Staten Island are falling more slowly than elsewhere. In the first half of 2025, they fell 8.6% compared with the first half of 2024, versus 18.4% citywide. Only Manhattan had a smaller decline. PIX11
Change is coming to the North Shore. Community District 1, covering Stapleton, Randall Manor, Westerleigh, West Brighton, Clifton and Shore Acres, is one of six districts the city has selected for full Empire Bin containerization by the end of 2027. In West Harlem, the first fully containerized district, reported sightings fell 34% in the first seven months of 2026. NYC Mayor's Office Bloomberg
What this means if you live on Staten Island
Because so few properties here are inspected, a rat problem on your block is unlikely to show up in city data until someone reports it. The Health Department's own prevention advice applies to every house: store garbage and food waste in hard containers with tight lids, seal cracks and holes in foundations and walls, keep yards trimmed and free of clutter, and report rats or conditions that attract them to 311. NYC Health
For a closer look at how mice get into houses, see our field notes on mouse entry points.
If you are seeing rats, droppings or burrows on your property, this is what we handle: rodent and wildlife removal across Staten Island, Brooklyn and Central New Jersey, including evenings and weekends.
Which Staten Island ZIP codes report the most rats?
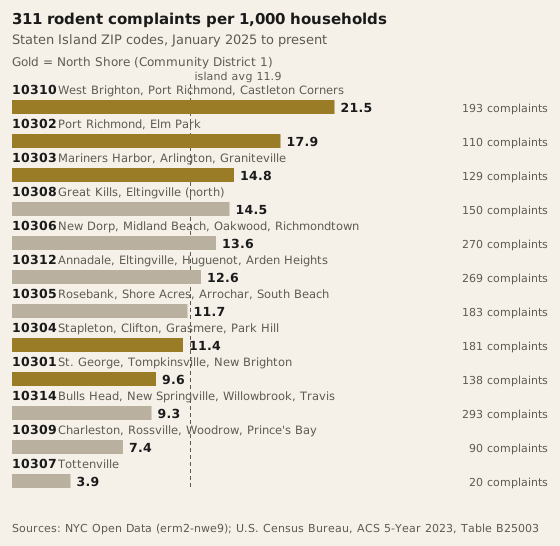
10310 — West Brighton, Port Richmond, Castleton Corners and Randall Manor — has the highest rate on Staten Island, at 21.5 rodent complaints per 1,000 households, nearly double the island-wide average of 11.9. The three highest rates on the island are all North Shore ZIP codes.
This is an original analysis. We pulled every rodent complaint filed with 311 from Staten Island since January 2025 from NYC Open Data, then divided by the number of occupied households in each ZIP code from the Census Bureau, so that larger ZIP codes are not penalised simply for having more people in them.
That step changes the picture completely. By raw count, the busiest ZIP code is 10314 — Bulls Head, New Springville, Willowbrook and Travis — with 293 complaints. It is also the most populous ZIP code on the island. Measured per household it ranks tenth of twelve. The North Shore as a whole reports 13.9 complaints per 1,000 households against 11.0 for the rest of Staten Island, about 1.26 times the rate.
| ZIP | Neighborhoods | Complaints | Households | Per 1,000 |
|---|---|---|---|---|
| 10310 | West Brighton, Port Richmond, Castleton Corners, Randall Manor | 193 | 8,982 | 21.5 |
| 10302 | Port Richmond, Elm Park | 110 | 6,159 | 17.9 |
| 10303 | Mariners Harbor, Arlington, Graniteville, Port Ivory | 129 | 8,742 | 14.8 |
| 10308 | Great Kills, Eltingville (north) | 150 | 10,323 | 14.5 |
| 10306 | New Dorp, Midland Beach, Oakwood, Bay Terrace, Richmondtown | 270 | 19,846 | 13.6 |
| 10312 | Annadale, Eltingville, Huguenot, Arden Heights, Greenridge | 269 | 21,366 | 12.6 |
| 10305 | Rosebank, Shore Acres, Arrochar, South Beach, Dongan Hills | 183 | 15,637 | 11.7 |
| 10304 | Stapleton, Clifton, Grasmere, Concord, Park Hill | 181 | 15,900 | 11.4 |
| 10301 | St. George, Tompkinsville, New Brighton, Silver Lake | 138 | 14,430 | 9.6 |
| 10314 | Bulls Head, New Springville, Willowbrook, Travis, Westerleigh | 293 | 31,419 | 9.3 |
| 10309 | Charleston, Rossville, Woodrow, Prince's Bay | 90 | 12,108 | 7.4 |
| 10307 | Tottenville | 20 | 5,135 | 3.9 |
The spread between the highest and lowest ZIP codes is 5.5 times. Tottenville (10307) reports 3.9 complaints per 1,000 households, the lowest on the island.
One caveat, stated plainly: 311 data measures where rats get reported, not where they live. A neighborhood that calls 311 more often will look worse than one that does not, regardless of actual rodent pressure. These figures should be read as a map of reported activity, not a census of rats.
The North Shore result does line up with the city's own actions: Community District 1, which covers much of this area, is one of the districts selected for full on-street trash containerisation by the end of 2027.
What are the rattiest neighborhoods in NYC?
The South Bronx and Upper Manhattan. In 2025, Kingsbridge Heights and Bedford in the Bronx had the highest share of properties with active rat signs, at 27.6%.
This ranking only includes community districts where the Health Department inspected at least 95% of properties in 2025, so the numbers reflect neighborhood-wide sweeps rather than complaints. NYC Health
Show the district data
| Community district | Properties inspected | Properties with active rat signs |
|---|---|---|
| Kingsbridge Heights & Bedford, Bronx (CD 7) | 96.5% | 27.6% |
| Highbridge & Concourse, Bronx (CD 4) | 97.4% | 27.3% |
| East Harlem, Manhattan (CD 11) | 100.0% | 22.1% |
| Central Harlem, Manhattan (CD 10) | 99.6% | 21.5% |
| Lower East Side & Chinatown, Manhattan (CD 3) | 100.0% | 21.1% |
| Washington Heights & Inwood, Manhattan (CD 12) | 96.4% | 20.6% |
| Morningside & Hamilton Heights, Manhattan (CD 9) | 98.7% | 20.3% |
| Bushwick, Brooklyn (CD 4) | 97.5% | 19.5% |
| Belmont & East Tremont, Bronx (CD 6) | 98.7% | 18.0% |
| Bedford Stuyvesant, Brooklyn (CD 3) | 98.8% | 16.9% |
Rates are improving in the city's Rat Mitigation Zones. In the first half of 2025, 18% of initial inspections in those zones led to an order to fix rat conditions, down from 24% in the first half of 2024. In Harlem the rate fell from 21% to 14%, and in Bushwick and Bedford-Stuyvesant from 27% to 18%. NYC Health
Can rats in NYC make you sick?
Yes. Rat urine spreads leptospirosis, and New York City cases have risen sharply since 2021.
- NYC recorded 24 human leptospirosis cases in 2023, the most ever in a single year. NYC Health
- Locally acquired cases averaged 15 a year from 2021 to 2023, compared with 3 a year from 2001 to 2020. NYC Health
- Six New Yorkers died of leptospirosis between 2001 and 2023. ABC News, citing NYC Health
- 33 dogs in NYC met the case definition for leptospirosis in 2024, with cases peaking in August. NYC Health
- Mouse urine and dander are strong allergens that can make asthma worse, according to the Health Department. NYC Health
Leptospirosis is treatable with antibiotics when caught early. In NYC, most locally acquired cases involve contact with rat urine at home or at work, including handling trash bags or bins with food waste. ABC News, citing NYC Health
What is NYC doing about rats?
Cutting off food. About 70% of the city's trash is now required to be in containers, and the city plans to containerize the rest by the end of 2031.
Trash containerization
- Businesses and residential buildings with 1 to 9 units must already use sealed bins, which together cover more than 70% of the city's trash. NYC DSNY
- West Harlem (Manhattan CD 9) became the first fully containerized district in June 2025, using about 1,100 on-street Empire Bins on a $2.1 million pilot budget. Bloomberg
- In April 2026, the city named six districts for full containerization by the end of 2027: Brooklyn CD 8, Bronx CDs 2 and 5, Queens CD 2, Manhattan CD 2 and Staten Island CD 1. NYC Mayor's Office
- Brooklyn CD 8 alone will get 1,096 Empire Bins serving about 25,000 homes. The city is adding about $15 million to the next year's expense budget and about $35.5 million in capital funding. NYC Mayor's Office
- The goal is containerized trash in all 59 community districts by the end of 2031. Announcing the plan, Mayor Zohran Mamdani said “the only disappointed constituency will be rats.” NYC Mayor's Office
Inspections and enforcement
- The Health Department receives about 40,000 rat complaints through 311 and conducts about 150,000 rat inspections a year. NYC Health
- In the first half of 2025, inspectors in the four Rat Mitigation Zones made about 36,600 initial inspections. 68% of follow-up compliance inspections resulted in a summons. NYC Health
- City exterminators made 9,704 extermination visits in those zones in the first half of 2025. NYC Health
- 80% of the 210 park properties in the zones failed their initial inspection in early 2025, down from 89% a year earlier. NYC Health
- The Health Department is piloting rat contraceptives in the Harlem zone and expanding carbon monoxide and carbon dioxide burrow treatments. NYC Health
The rat czar
Kathleen Corradi, appointed in April 2023 as the city's first Director of Rodent Mitigation, stepped down in September 2025. NY1 Before leaving office, Mayor Eric Adams created a permanent Mayor's Office of Rodent Mitigation by executive order. New York Post
How does NYC compare to other U.S. cities?
New York ranked third on Orkin's 2025 Rattiest Cities list, the same spot as in 2024.
Los Angeles took the top spot for the first time, ending Chicago's decade-long run at No. 1. Chicago fell to No. 2 and San Francisco ranked No. 4. Orkin ranks cities by new rodent treatments at owner-occupied homes, in this case from August 20, 2024 to August 21, 2025, and does not adjust for population. Orkin
Orkin typically publishes its list in late October. We will update this section when the 2026 list is released.
Frequently asked questions
How many rats are in New York City?
No one has counted them directly. The most cited estimate, from Columbia statistician Jonathan Auerbach in 2014, put the population at about 2 million using 311 reports from 2010 and 2011. A 2023 replication of his method by a pest control company estimated nearly 3 million. Both are rough upper-bound estimates, not counts.
Which NYC borough has the most rats?
The Bronx. In 2023, 42.2% of Bronx households reported mice or rats in their home or building, the highest share of any borough, and the two community districts with the highest share of properties showing active rat signs in 2025 were both in the Bronx. Staten Island had the lowest household rate at 10.5%.
Are rats getting worse in NYC?
Reported sightings are falling. Rat sightings reported to 311 dropped 20.6% between December 2024 and November 2025 compared with the year before, and they were down about 22% in the first seven months of 2026. Household surveys tell a different story: the share of homes reporting mice or rats rose from 24.3% in 2021 to 26.8% in 2023.
Does Staten Island have a rat problem?
Staten Island has the lowest rate of any borough, but it is rising fastest. The share of Staten Island households reporting mice or rats went from 7.3% in 2021 to 10.5% in 2023, a 44% relative increase. The city inspected fewer than 1 in 100 Staten Island properties for rats in 2025, so official inspection data shows very little of the problem there.
What is the rattiest neighborhood in NYC?
Among neighborhoods where the Health Department inspected nearly every property in 2025, Kingsbridge Heights and Bedford in the Bronx had the highest share of properties with active rat signs (27.6%), followed closely by Highbridge and Concourse in the Bronx (27.3%).
Can you get sick from rats in New York City?
Yes. Rat urine can spread leptospirosis, a bacterial infection that can damage the kidneys and liver. New York City recorded a record 24 human cases in 2023, compared with an average of about 3 cases a year from 2001 to 2020. Mice droppings and dander can also worsen asthma.
When are rats most active in NYC?
Sightings peak in late spring and summer. In the 12 months ending November 2025, reported sightings were highest in June (2,319) and lowest in November (931).
Methodology and sources
We used official city data wherever it exists and checked every figure against its original source before publishing. News reports are cited only where they report data not published elsewhere.
Borough and district inspection data. Figures come from the NYC Health Department's Environment & Health Data Portal, "Rat inspections" indicator, downloaded from the department's public data repository. The portal reports the share of all tax lots inspected and the share of all tax lots with active rat signs. To compare boroughs with very different inspection coverage, we divided the second figure by the first to estimate the share of inspected properties with active rat signs. In boroughs where inspections are mostly complaint-driven, this rate reflects properties people reported, not a random sample.
Household data. Household rates come from the NYC Housing and Vacancy Survey (2021 and 2023), as published by the Health Department, with 95% confidence intervals. Outdoor sighting rates come from the 2020 NYC Community Health Survey.
311 data. Monthly sightings come from the Department of Sanitation. 311 counts reflect reports, not rat populations.
- NYC Department of Sanitation: rat sightings down 12 straight months (Dec 2025)
- NYC Health: Environment & Health Data Portal, mice and rats
- NYC Health: EHDP data repository (GitHub)
- NYC Health: Rat Mitigation Zone Report, Jan to Jun 2025
- NYC Health: Inspection data are the key to controlling NYC's rats
- NYC Health: 2024 Health Advisory #10, leptospirosis
- NYC Health: 2025 Veterinary Advisory #10, canine leptospirosis
- NYC Mayor's Office: containerization announcement transcript (Apr 2026)
- Bloomberg, via HumanProgress: NYC reports fewer rat sightings (2026)
- Hoodline: East Village rat complaints rise while citywide sightings fall (Jul 2026)
- PIX11: rat sightings down 18% in NYC (2025)
- Orkin: 2025 Top 50 Rattiest Cities (Oct 2025)
- NPR / WGBH: NYC's rat population might be seriously overestimated (2014)
- Pest Management Professional: NYC rat population grows to 3 million (2023)
- ABC News: human infections from rat urine on the rise in NYC (2024)
- NY1: NYC's first rat czar steps down (Sep 2025)
- New York Post: Adams creates Office of Rodent Mitigation
Cite or reuse this data
Journalists, researchers and writers are welcome to use any statistic or chart on this page. Our original analysis is licensed under CC BY 4.0: please credit After Hours Pest Control and link to this page.
Citation
Embed a chart
Paste this HTML to embed the Staten Island chart with credit.
<a href="https://www.afterhourspestcontrol.com/nyc-rat-statistics.html"><img src="https://www.afterhourspestcontrol.com/nyc-homes-mice-rats-by-borough.svg" alt="Share of NYC households reporting mice or rats by borough, 2021 vs 2023" width="560"></a><br>Source: <a href="https://www.afterhourspestcontrol.com/nyc-rat-statistics.html">After Hours Pest Control, NYC Rat Statistics 2026</a>
Seeing rats or droppings? Text us a photo.
Send a picture, your address and what you're seeing. We'll tell you what you're dealing with and what it takes to fix it.
Text (646) 681-5642 Serving Staten Island, Brooklyn, Manhattan and Central New Jersey.